For most users of StockIQ, you are controlling your forecasts at the bottom of your forecast hierarchy, at the item-site-forecast group level. If you are auto-forecasting, your statistical model (red line) will exactly match your operational forecast (blue line) for the current period forward at this bottom level, like so:
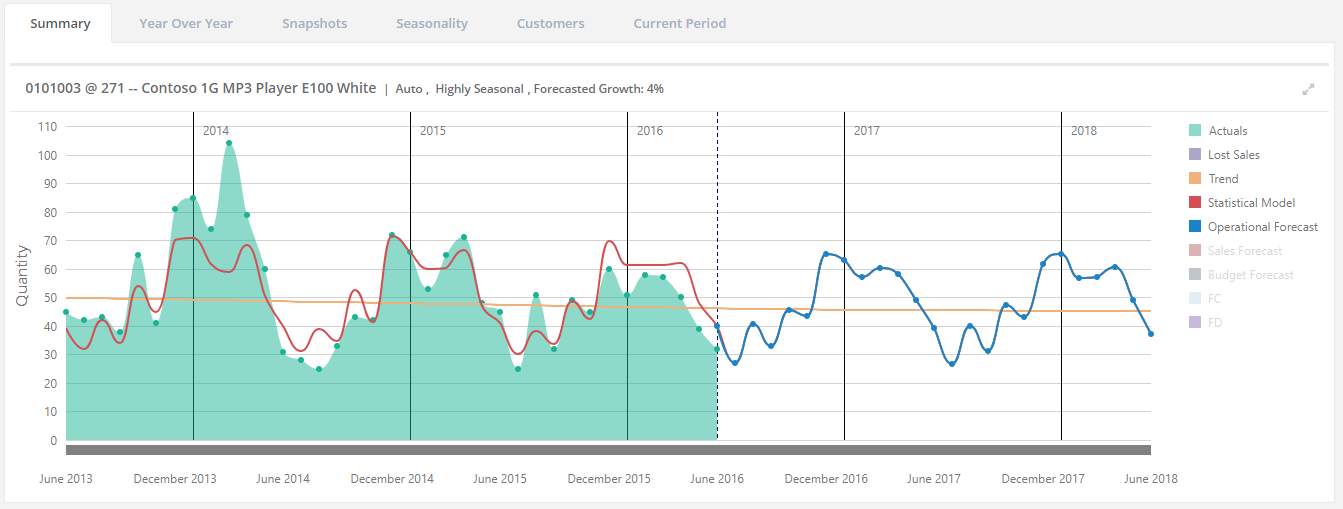
So, in this situation, your actuals are being used to generate a forecast for each one of your item-site-forecast groups.
Using the hierarchy, StockIQ will then sum those forecasts up the hierarchy, so that you can see the total forecast for each item-site, each item, and then each product group or category that you have configured.
Additionally, at each level of your hierarchy, StockIQ will calculate a statistical model based on the aggregated demand at that level. In this situation, demand is being summed, and one statistical model is generated, such as in this item-level forecast here:
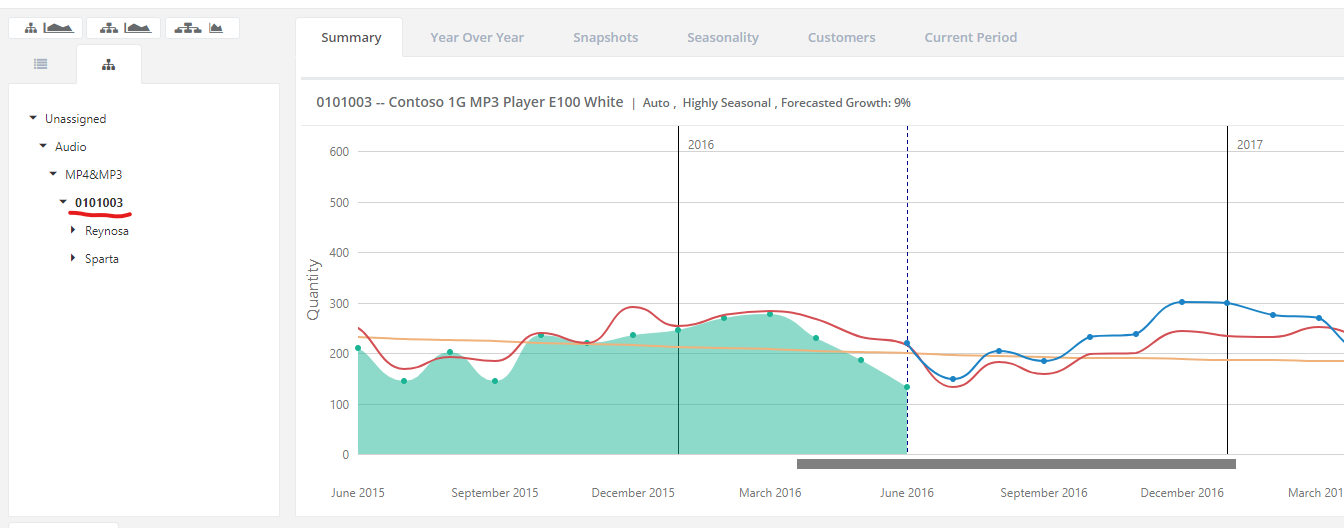
Thus, you will get two different time series, since the statistical forecast algorithm is operating with different data at different levels of the hierarchy; In the first situation, it takes your demand and generates forecasts, and the forecasts are summed. At a higher level of the hierarchy, it is the demand that is summed first, and then the statistical model is generated from that.
As a result, you typically get slightly different results between the hierarchy-level statistical forecast, and the operational forecast at that level of the hierarchy, which is generated from the sum of lower-level forecasts.
Top Down Forecasting
The same situation, but reversed, can happen when you are doing some sort of top-down forecast. If you have set a manual or auto forecast at the item-site level, but you have several different forecast groups, your individual forecast-group level forecasts will be different than the statistical model at the bottom level, since the operational forecast is being controlled in a top-down fashion from that higher level of the hierarchy.