Summary
This article discusses the two main KPI's you can use in StockIQ for evaluating forecast quality, and the variations on them, and how they are calculated
Applies To
All Items in StockIQ
Process
Forecast Error = (Actual Value of sales) - (Forecasted Value)
Regardless of what error measure you use, in StockIQ, we find it useful to show the value for the actual error value itself, along with a percentage, and also the dollar/currency value associated with the error, to help you prioritize the most important measures first.
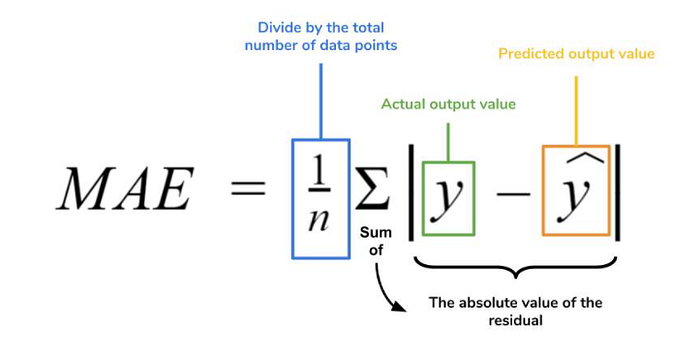
Mean Absolute Error (MAE)
Since knowing the error of any one period is not often very useful, most of the time you measure error over a number of samples, so you end up with a total error over that time period.
Further, since you want to know in total how wrong you were, typically you will take the absolute value of the error, so you're summing up how wrong you were, on either side, for your observations.
Divide your sum by the number of periods you measured error for, and you have the average of the absolute value of your errors, otherwise known as Mean Absolute Error (MAE), which tells you the average number of units of error you can expect from that forecast series in each forecasting period.
Since MAE is a units-based number, you don't know if a given MAE is good or bad without knowing something about your product. Say you have an MAE of 10. Is that good? If you sell 500 units a month, that is great! If you sell 5 units a month, that's pretty terrible.
To make the MAE number into a percent, divide by your average usage over the period that you have measured, and you have Mean Absolute Error Percent (MAE%), which is then a number you can compare between different SKUs.
Root Mean Squared Error (RMSE)
The other error calculation supported in StockIQ for reporting forecast error is RMSE%. This is similar to MAE%, except that the errors are squared as part of the calculation. This has the effect of penalizing larger mistakes more heavily than MAE%:
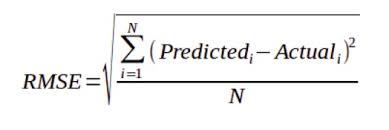
As with MAE, you can divide by your usage over the period you have measured to obtain an RMSE%, so your error number can be compared to other error measures.
Mean Absolute Percent Error (MAPE)
A value commonly used in the forecasting industry is MAPE (Mean Absolute Percent Error), and it is often confused with MAE% - we find sometimes people think they have been using MAPE, when in fact they are calculating MAE%:
IMPORTANT: StockIQ DOES NOT recommend the use of MAPE. It is calculated by averaging the mean error percentages, i.e. you are averaging percentages instead of the values themselves. This leads to highly penalizing errors on periods of low demand, and rewards under forecasting. Do not use MAPE.
Bias
The other important calculation to monitor in forecasting is your bias. A bias in a forecast means you are consistently over- or under-forecasting a product over time, and is also highly problematic. As with error, bias is most useful when measured over a period of time, versus looking at single values.
As with the error calculations, converting the absolute bias quantity into a percentage is typically helpful as well.
Single Period Bias = (Forecasted Value) - (Actual Value)
Average Bias = (Single Period Biases) / (Number of Periods Measured)
Bias Percent = (Average Bias) / (Average Actuals Over Periods Measured)
Error Calculation Time Periods (Leads & Lags)
The other question when calculating your average error is over what time period to calculate the average error. This is not always straightforward.
For current period forecasts and statistical forecasts, your only option is to calculate backwards looking error values. This gives you an expectation of what your error values might be knowing everything you know today.
In StockIQ, we keep forecast snapshots of history, so that you can see how your forecasts have changed over time. These are called "Lagging Forecasts." It is common to want to see your "Lag 1" "Lag 2" or "Lag 3" forecasts, meaning you want to see forecasts from 1, 2, and 3 periods ago.
These are interesting since you can ask the question "What is my forecast accuracy for the lag when I am ordering", e.g. "what is my forecast error when I am one lead time away from receiving my product?"
Consider the following simple time series of a product where we sit on December 1st of a year, and we are looking to calculate error using a 6-month MAE:
Backwards Looking Error
The green, yellow, red, and orange areas show the periods we would use to calculate a backwards looking error value on each of the forecasts, given the period in which they were captured. You can set the length for your error calculations in the Global Demand Forecast Settings. 6 and 12 months are common horizons for this.
Error Vs Current & Back-Testing
The gray area on each of the forecast snapshots represents periods where actuals were UNKNOWN at the time the snapshot was taken.
For forecast snapshots and back-dated statistical models, where demand history is hidden from the algorithm (such as for training the forecast model), you can also calculate an error "Versus Current". This means we are calculating your error from current period back, but from a snapshot in time that did not know some of the results at the time the snapshot was taken.
This incorporates the periods that were not known at the time the snapshot is generated, giving you a sense of what your forecast error will be at that amount of lag.
This approach is used when evaluating statistical models for performance, as it avoids over-fitting the model to your current data, since it tests how well the model can perform against unknown values by hiding known data, then testing the model on the know data after it is generated.